


Introduction :
In the world of stock trading, having the right tools and strategies at your disposal can make all the difference. One such tool is the Relative Strength Index (RSI) technical indicator. In this comprehensive guide, we’ll delve deep into RSI shifts, exploring its origins, how it works, and most importantly, how you can use it to enhance your trading success.
Understanding RSI – What is it?
RSI Basics:
The RSI, or Relative Strength Index, is a momentum oscillator that measures the speed and change of price movements. It was developed by J. Welles Wilder in 1978 and has since become an essential tool for technical analysts and traders.
How RSI Works:
RSI is plotted on a scale from 0 to 100 and is typically used to identify overbought and oversold conditions in a market. Values above 70 indicate overbought conditions, suggesting a potential reversal to the downside, while values below 30 suggest oversold conditions and a possible upward reversal.
Interpreting RSI shifts Signals for Day trading and Swing trading strategies
Bullish Signals:
Learn how to recognize RSI patterns that indicate potential bullish trends and how to capitalize on them. We’ll cover key strategies for spotting these signals.
Bearish Signals:
Discover RSI patterns that signal possible bearish trends and how to protect your investments or even profit from falling markets.
Incorporating RSI into Your Trading Strategy
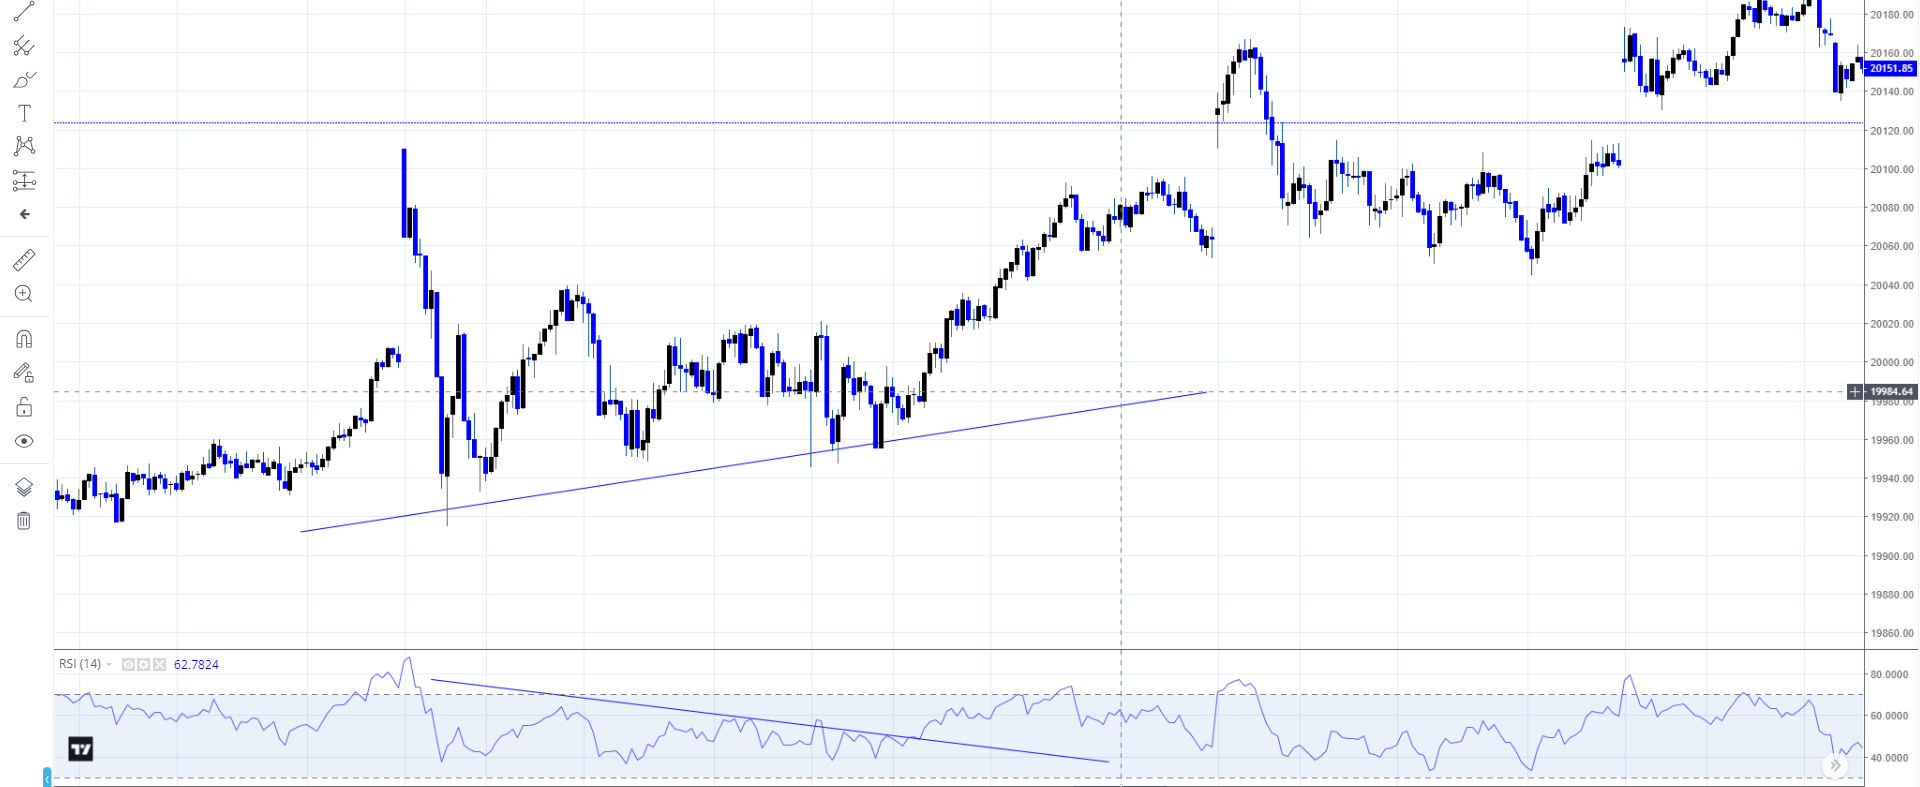
RSI Divergence:
Explore the concept of divergence and how it can be a powerful tool when combined with RSI to predict trend reversals.
Using RSI with Other Indicators:
Learn how RSI can complement other technical indicators like Moving Averages, MACD, and Bollinger Bands to refine your trading strategy.
Practical Tips for Successful RSI Trading
Setting the Right Time-frame:
Understand how the choice of timeframe can impact the accuracy of RSI signals and choose the best one for your trading style.
Risk Management:
Discover effective risk management techniques to protect your capital and minimize losses while trading based on RSI signals.
What are the best settings for the Relative Strength Index (RSI)?
The best settings for the Relative Strength Index (RSI) can vary depending on your trading style, the asset you’re trading, and the timeframe you’re using. RSI is a versatile indicator, and different settings may be more appropriate for different situations. Here are some common RSI settings and their applications:
- Standard Settings (14-period RSI): The default and most commonly used setting for RSI is a 14-period RSI. This means it calculates the RSI based on the closing prices of the last 14 periods. This setting is a good starting point for many traders and works well for daily charts.
- Short-Term Trading (7-period RSI): If you are a short-term trader, such as a day trader or a swing trader operating on shorter timeframes, you may consider using a 7-period RSI. This shorter timeframe will make the RSI more sensitive to recent price changes.
- Long-Term Trading (21-period RSI): Long-term investors or traders who focus on weekly or monthly charts might prefer a 21-period RSI. This setting smooths out the RSI and can help filter out short-term noise.
- Custom Settings: You can experiment with custom settings to suit your specific trading strategy and the asset you’re trading. For instance, for highly volatile assets, you might want to use a longer RSI period to reduce false signals, while for less volatile assets, a shorter period may be more appropriate.
- Divergence Analysis: When using RSI divergence analysis (a powerful technique for identifying potential reversals), some traders use a shorter RSI period (e.g., 9 or 10) to make the indicator more sensitive to price changes.
- Overbought and Oversold Levels: By default, RSI uses 70 as the overbought level and 30 as the oversold level. You can adjust these levels based on your risk tolerance and the asset you’re trading. Some traders prefer 80/20 or 75/25 as overbought/oversold levels.
- Smoothed RSI: Some traders use a smoothed RSI, which is calculated by applying a moving average to the standard RSI values. This can help reduce false signals in choppy markets.
Remember that there is no one-size-fits-all setting for RSI. It’s essential to backtest different settings on historical data and consider how they align with your trading strategy. Additionally, combining RSI with other technical indicators can provide more robust trading signals and help confirm your analysis. Always use RSI as part of a comprehensive trading strategy and consider the broader market context before making trading decisions.
Conclusion
In conclusion, the Relative Strength Index (RSI) is a versatile and powerful tool that can significantly enhance your trading performance. By understanding its fundamentals, interpreting its signals, and incorporating it into a well-thought-out trading strategy, you can gain an edge in the competitive world of financial markets.
Remember, successful trading is not just about knowing when to buy or sell; it’s also about managing risk and staying disciplined. With the knowledge and strategies presented in this guide, you’ll be better equipped to make informed trading decisions and increase your chances of achieving trading success with RSI.
So, whether you’re a novice trader looking to get started or an experienced one seeking to refine your skills, mastering RSI can be a game-changer in your journey toward financial prosperity. Happy trading!


